API Status
API Health Monitoring
Signzy's Self Serve Portal gives you three complementary ways to track the health of the APIs you use: the live status page, email alerts, and webhook-based health polling. Together, these let you monitor API performance passively (in the dashboard), reactively (via email when something breaks), and programmatically (via automated polling into your own systems).
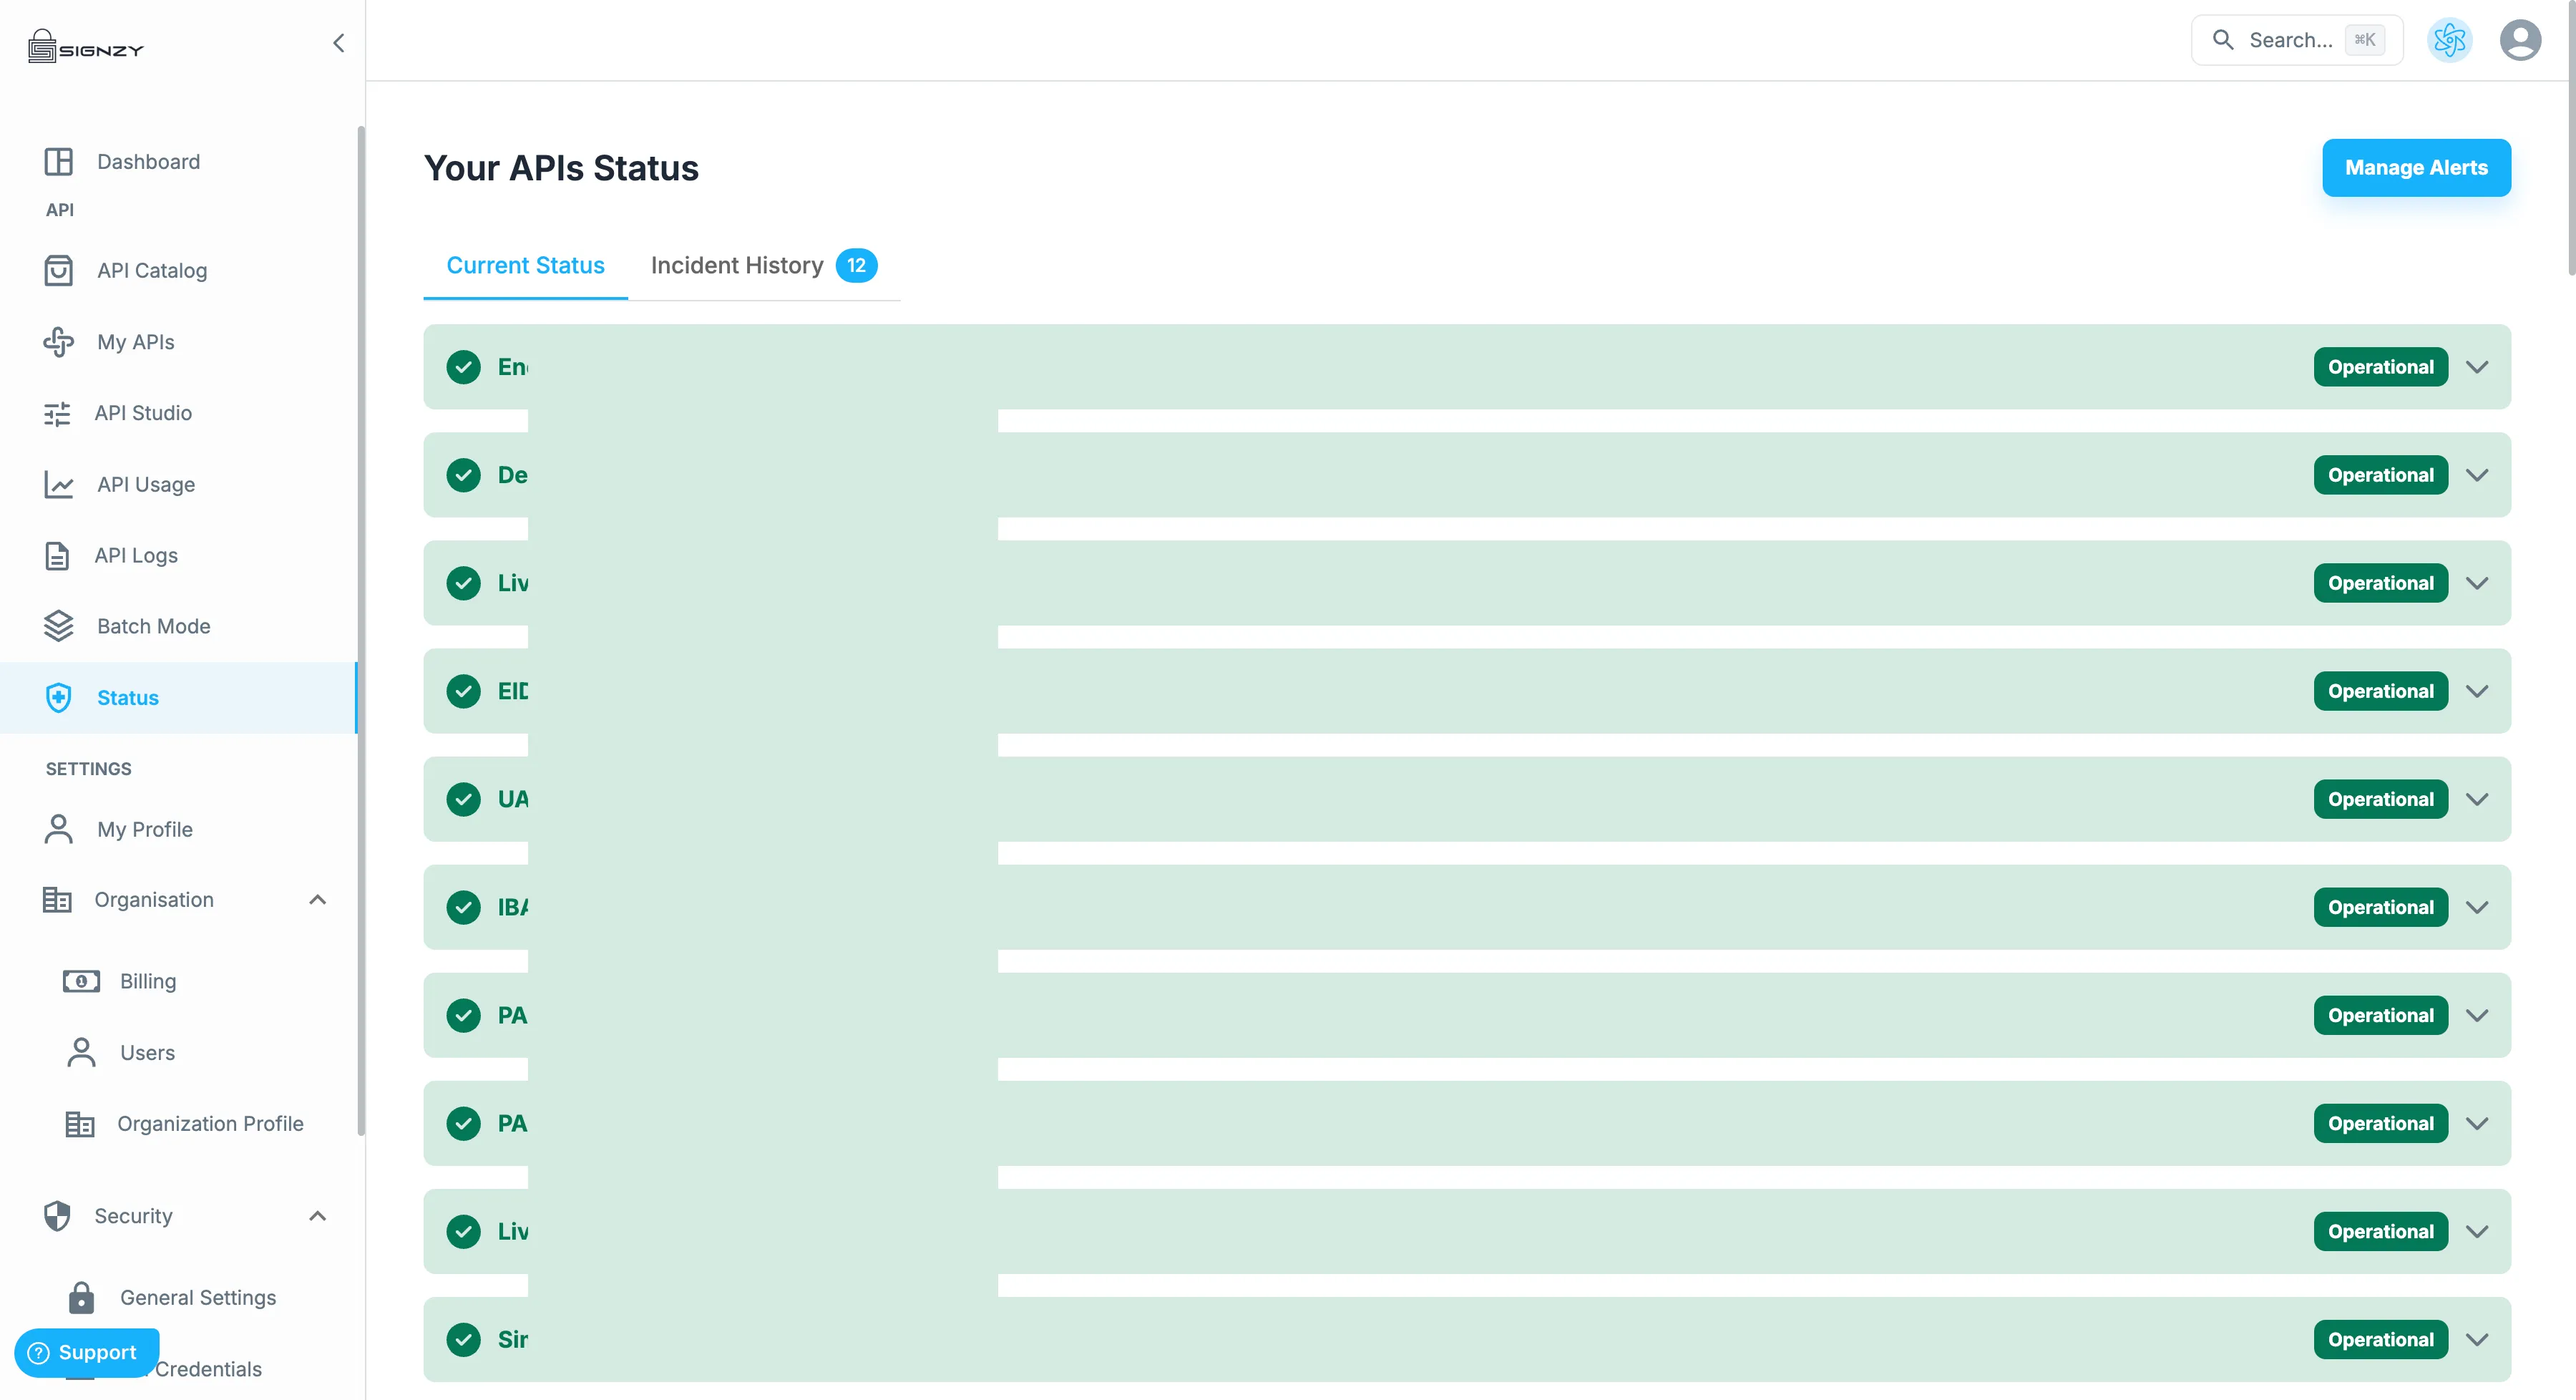
1. Live Health & Status Page
The Status page (Status in the left navigation, or https://portal.signzy.app/#/api-health) shows the real-time operational status of every API in our catalog.
What you get:
- Real-time status updates — see the current operational state (e.g. Operational, Degraded, Down) of each API as soon as it changes, so you always have up-to-date visibility without needing to check with support.
- Incident history — a running log of past incidents, including how long each one took to resolve, so you can audit reliability over time.
- Uptime reports — aggregate uptime percentage for each API over a selected time frame, useful for SLA tracking and internal reporting.
- Email notifications — instant email alerts whenever an incident or planned maintenance affects an API you're subscribed to.
2. Managing Email Alert Subscriptions
By default, alerting is opt-in per API — you choose which APIs you want to be notified about.
To subscribe or unsubscribe from alerts for specific APIs:
- Go to Status in the left navigation.
- Click Manage Alerts (top right of the Status page).
- In the Manage API Alerts panel:
- Use the Search box to quickly find a specific API by name.
- Check the box next to each API you want email alerts for.
- Check Select All APIs if you want to subscribe to every API at once.
- Uncheck a box to unsubscribe from alerts for that API.
- Click Update to save your changes.
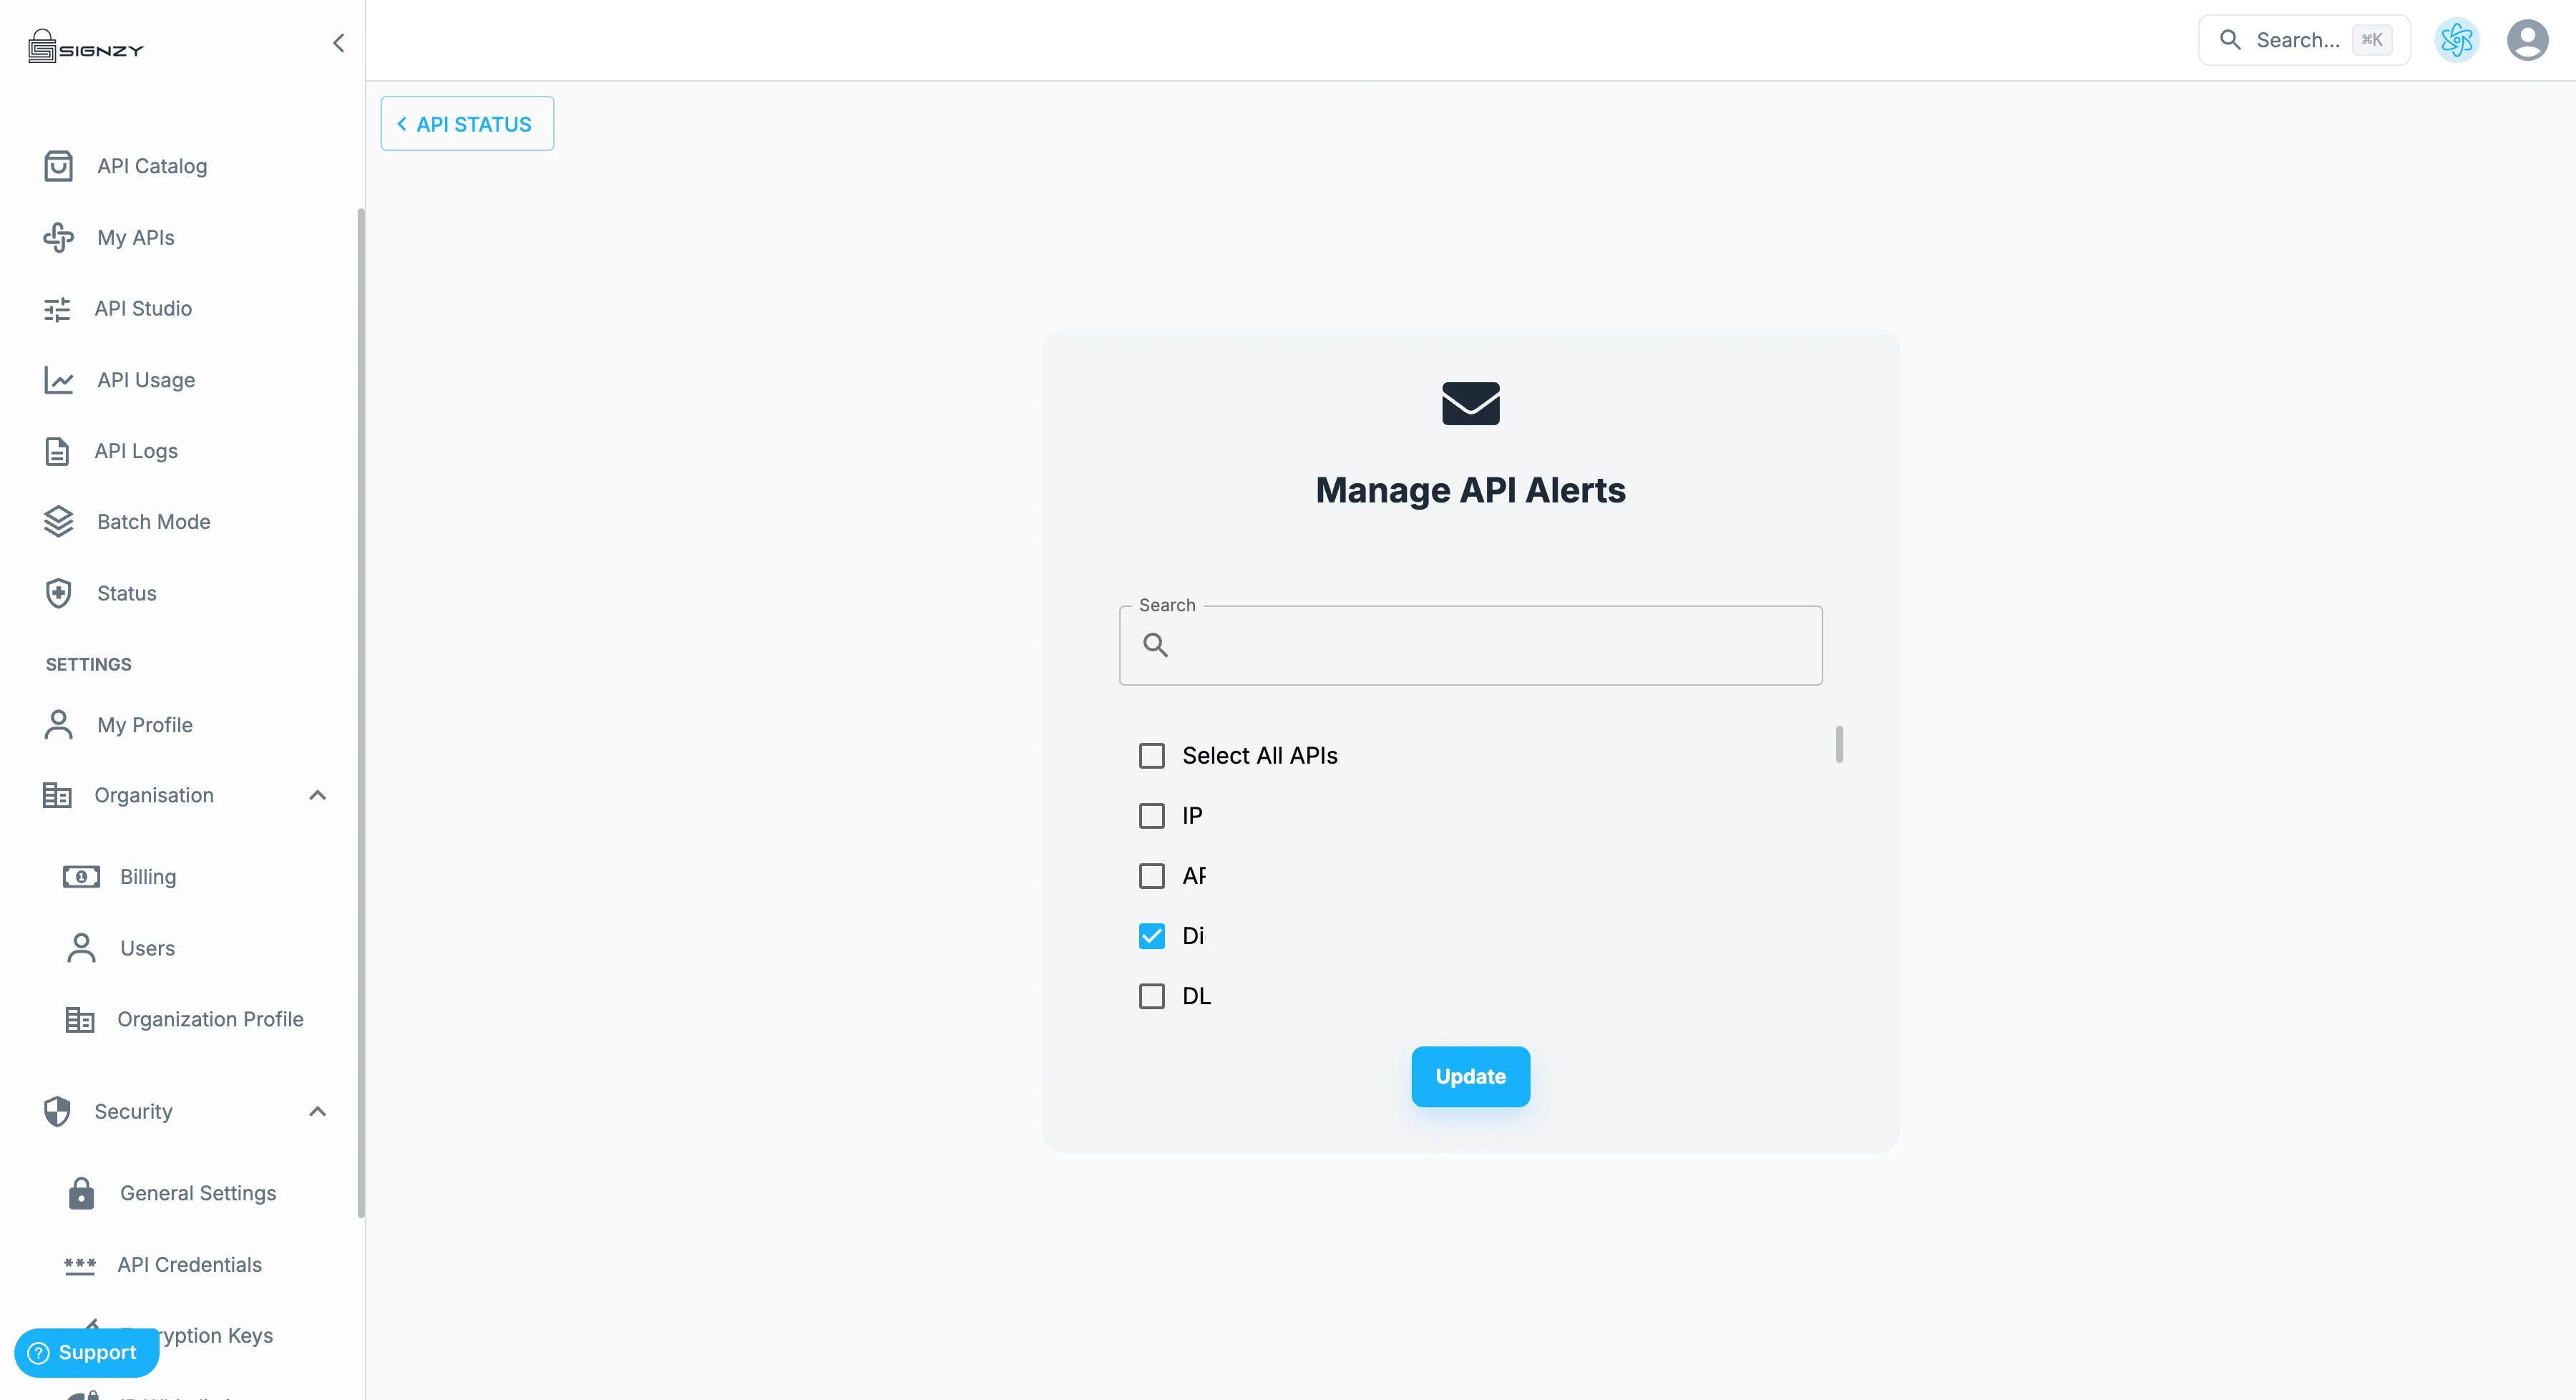
Once subscribed, you'll receive an email whenever there's an incident or scheduled maintenance affecting that specific API. Unsubscribing simply stops future emails for that API — it does not affect your API access or usage.
3. Webhook-Based Health Polling
For teams that want to monitor API performance programmatically rather than watching a dashboard or waiting on email, Signzy supports a polling webhook that pushes performance metrics directly to an endpoint you control.
Unlike the status page and email alerts (which are tied to the catalog-wide status of an API), the webhook reports metrics scoped to a specific API credential — i.e., performance for the APIs actually being consumed under that credential, in the environment you select (Live or Test).
3.1 Where to configure it
- Go to Security > API Credentials (https://portal.signzy.app/#/api-credentials).
- Locate the credential you want to monitor in the Live or Test table.
- Click the ⋮ (more options) menu at the end of that credential's row.
- Select Webhook Settings from the menu (the other option here, View IP Details, is unrelated to health monitoring).
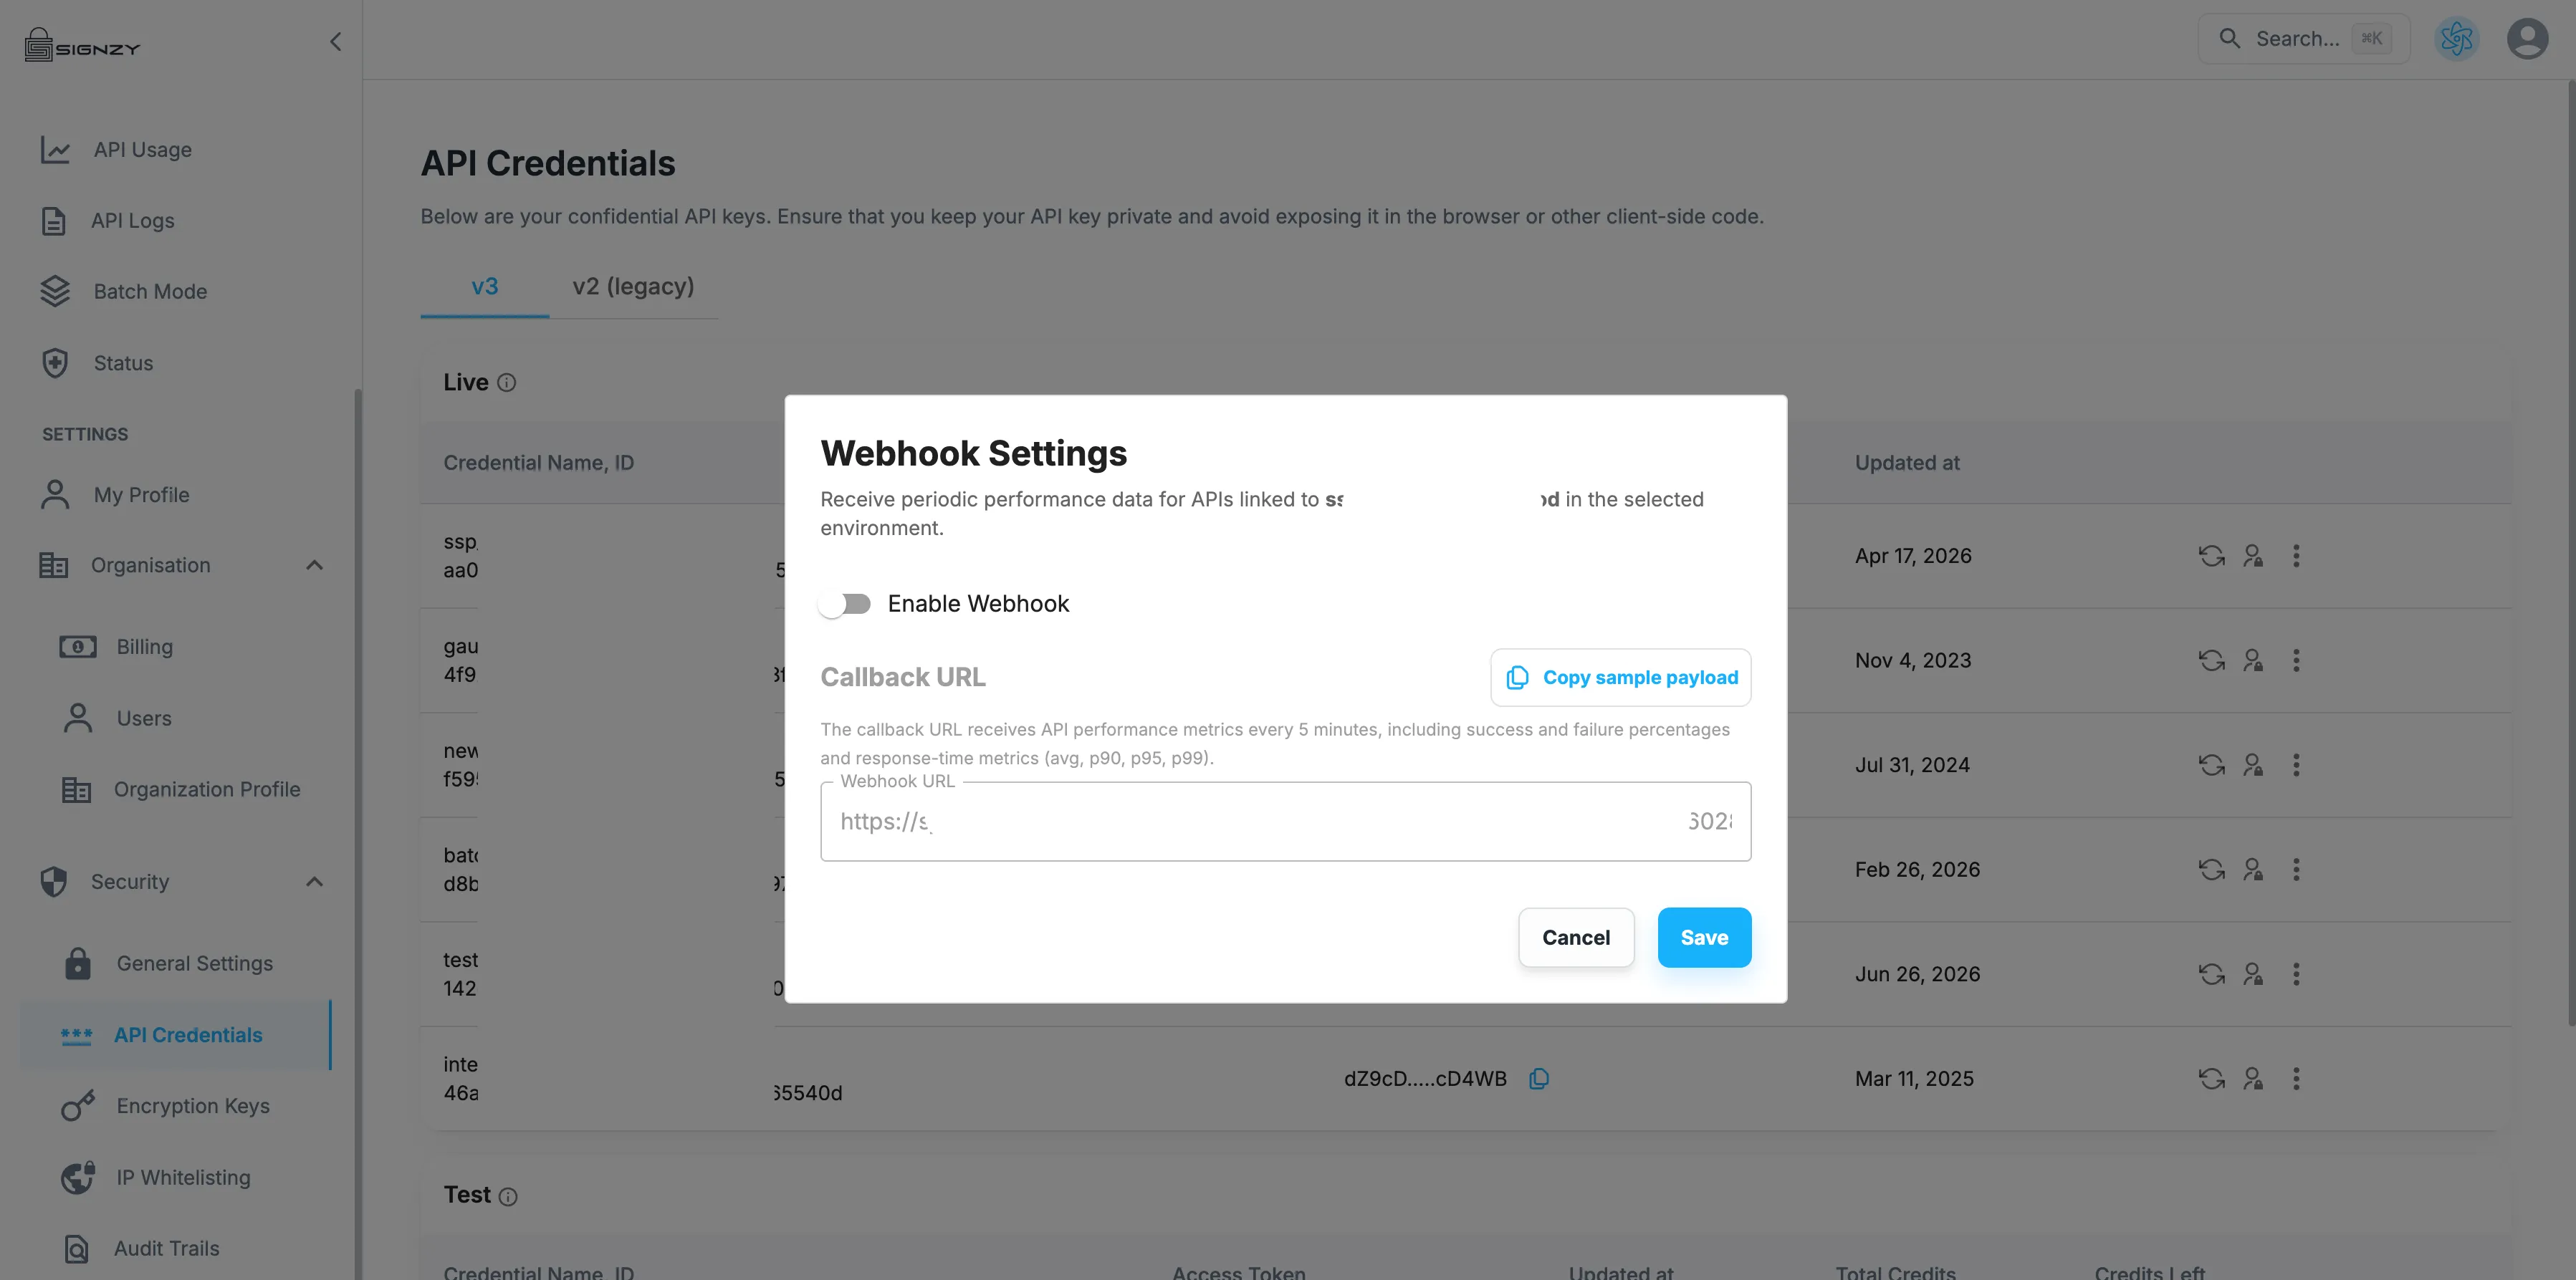
3.2 Setting up the webhook
In the Webhook Settings dialog:
- Toggle Enable Webhook on.
- Enter your Webhook URL — this is the callback endpoint on your side (e.g. an n8n workflow, internal monitoring service, or custom listener) that will receive the payload.
- Optionally, click Copy sample payload to grab an example JSON payload for testing your endpoint before going live.
- Click Save.
Once enabled, the callback URL will start receiving data automatically — no further action is needed on your end.
3.3 What data you receive
The callback URL receives a performance snapshot every 5 minutes, covering all APIs linked to that credential in the selected environment. Each payload is a JSON array with one object per API, structured like this:
[
  {
    "productId": "SIGNZY2025XYZ",
    "displayName": "API Name",
    "successPercentage": 100,
    "failurePercentage": 0,
    "avgResponseTime": 8374.15,
    "p90": 12032.8,
    "p95": 16686.8,
    "p99": 36154.96
  }
]
Field | Description |
|---|---|
productId | Unique identifier of the API product |
displayName | Human-readable name of the API |
successPercentage | Percentage of successful calls in the 5-minute window |
failurePercentage | Percentage of failed calls in the 5-minute window |
avgResponseTime | Average response time (ms) over the window |
p90 | 90th percentile response time (ms) |
p95 | 95th percentile response time (ms) |
p99 | 99th percentile response time (ms) |
3.4 Why use the webhook instead of (or alongside) email alerts
Email alerts and the status page tell you that something is wrong, after the fact, at the level of the overall API product. The webhook is designed to complement that with something more granular and machine-consumable:
- Continuous, structured data — not just incident notifications. Email alerts only fire when there's an incident or maintenance event. The webhook sends a metrics snapshot every 5 minutes regardless of whether anything is broken, so you get a constant stream of performance data rather than sparse, binary "up/down" notifications.
- Latency and percentile visibility, not just availability. Email alerts tell you an API went down. The webhook tells you success/failure rates and response-time distribution (avg, p90, p95, p99), so you can catch gradual degradation — like rising p99 latency — well before it becomes an outage that would trigger an incident alert.
- Credential- and environment-scoped, not catalog-wide. Status page incidents and email alerts reflect the health of an API across all of Signzy's customers. The webhook reports performance specific to your credential and your selected environment (Live/Test), which better reflects what your integration is actually experiencing.
- Machine-readable and automatable. JSON payloads can feed directly into your own monitoring stack, dashboards, or alerting rules (e.g. Datadog, Grafana, PagerDuty, or a custom workflow like n8n) — enabling automated responses (auto-scaling, failover, custom thresholds) rather than requiring a human to read an email and act.
- No manual subscription management required. Once enabled per credential, all APIs used under that credential are covered automatically — there's no need to individually opt in/out per API the way you do with email alerts in Manage Alerts.
Recommended usage: Keep email alerts enabled for the APIs you consider business-critical, so you're notified immediately of confirmed incidents. Use the webhook alongside it to feed continuous performance data into your own observability tooling, so you can detect and act on emerging issues (e.g. slow creep in latency or failure rate) before they escalate into an incident that triggers an email.